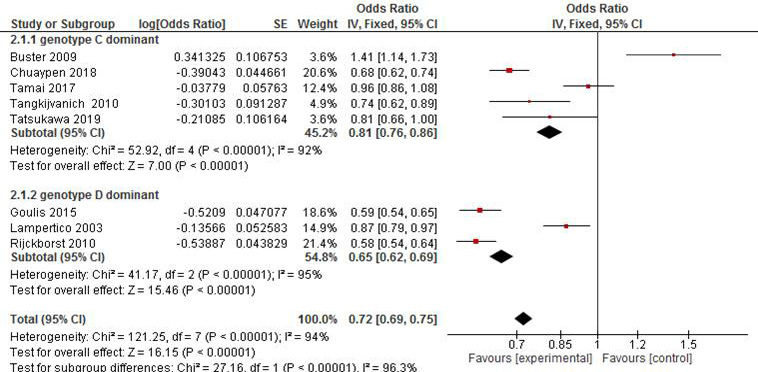
Fig. 4.
Distribution of studies having genotype C or D dominant population based on the ratio of the number of responders to non-responders. The 95% confidence interval for each study is plotted in horizontal lines around the baseline ratio. The rhombic mark is the result of a combination of studies with a 95% confidence interval.